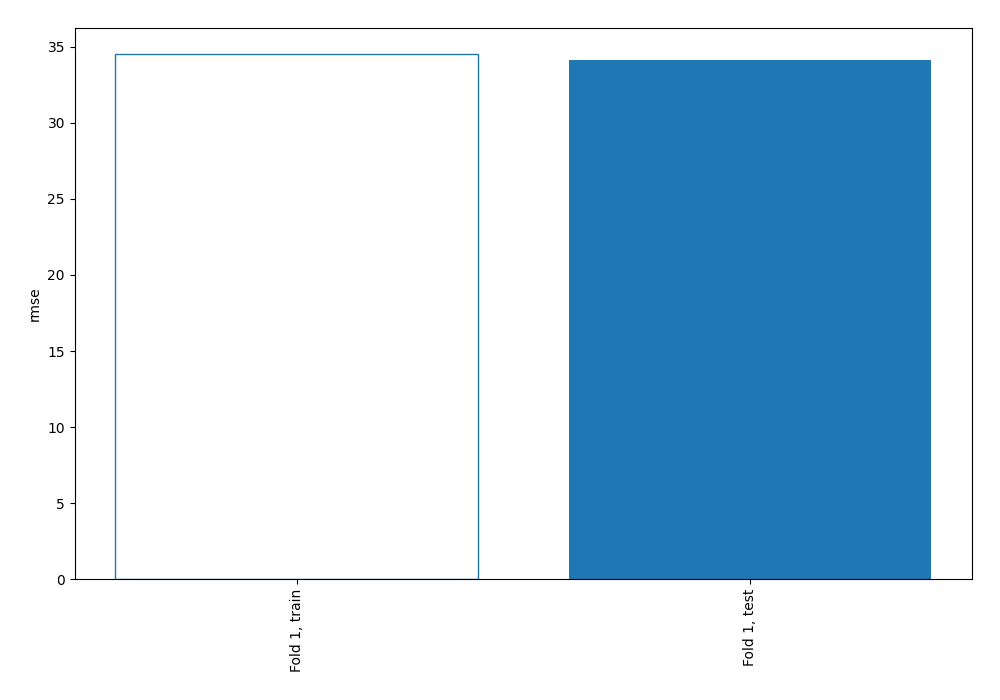
rmse
3.7 seconds
| Metric | Score |
|---|---|
| MAE | 12.9427 |
| MSE | 1165.05 |
| RMSE | 34.1329 |
| R2 | 0.946339 |
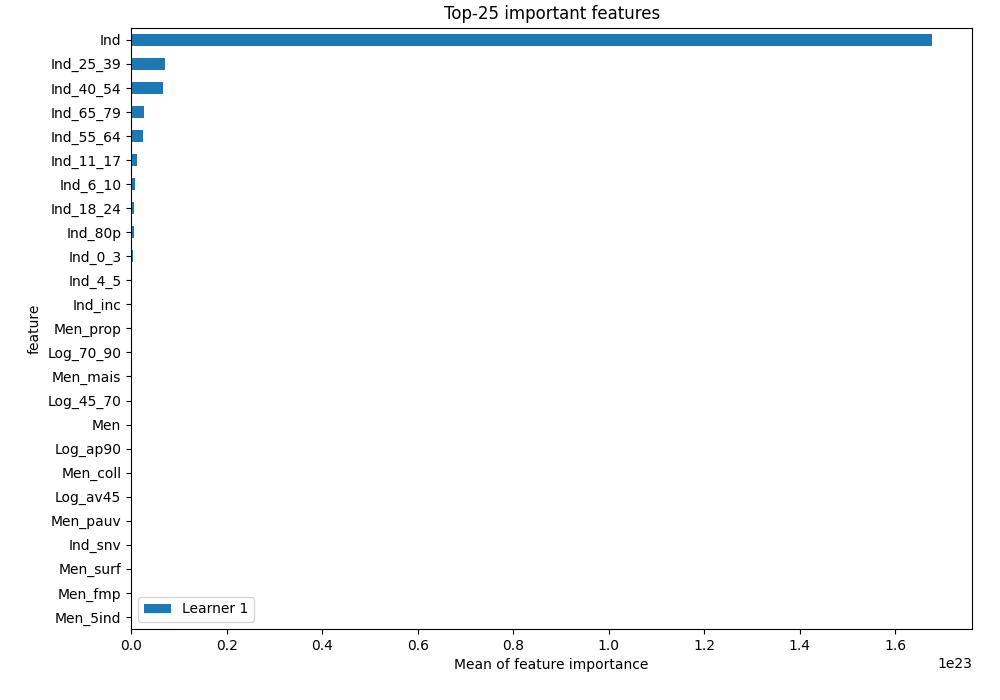
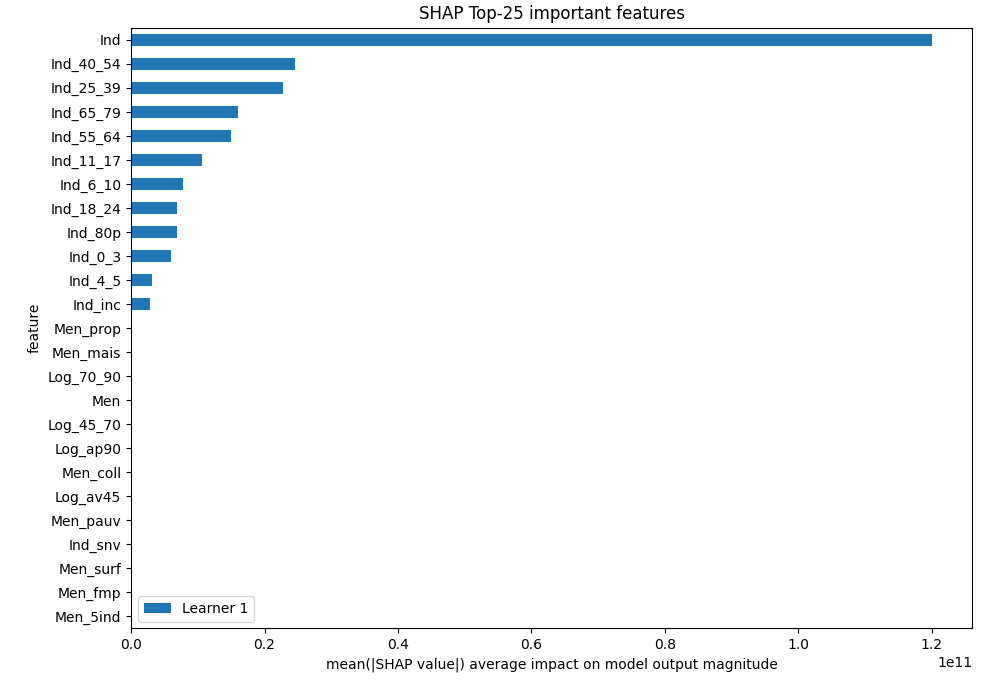
| feature | Learner_1 |
|---|---|
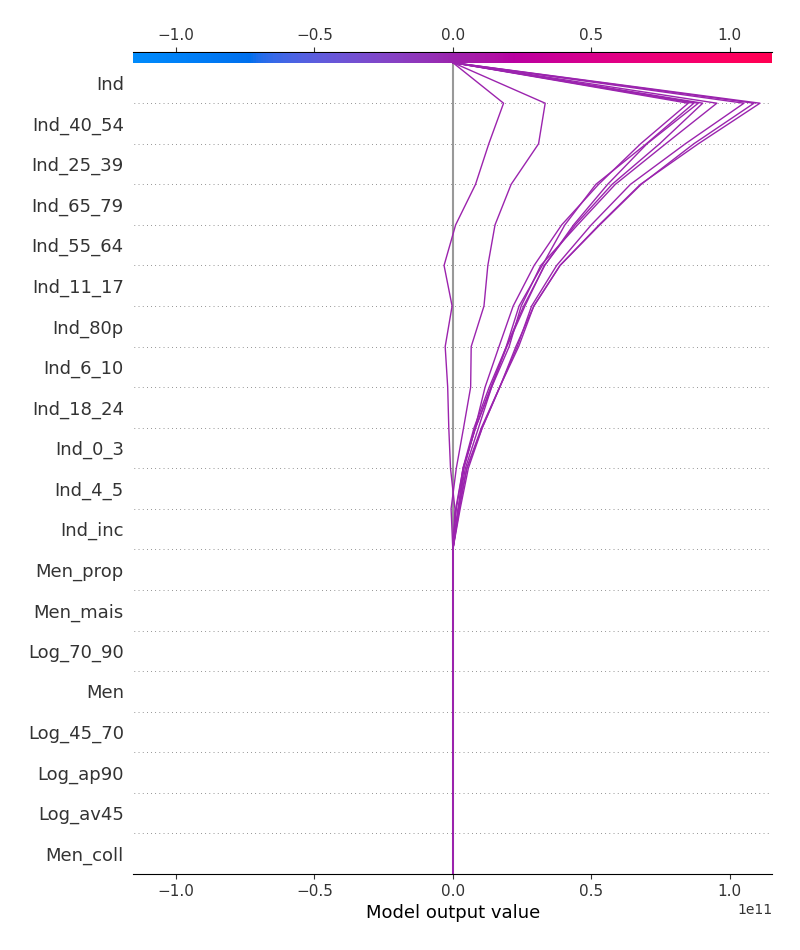
| Ind | 3.84143e+11 |
| Log_70_90 | 0.711794 |
| Men_mais | 0.709293 |
| Log_45_70 | 0.612752 |
| Men | 0.605774 |
| Log_ap90 | 0.455164 |
| Men_coll | 0.399937 |
| Log_av45 | 0.333267 |
| Men_fmp | 0.0969623 |
| I_pauv | 0.0347448 |
| Men_1ind | 0.0149348 |
| t_maille | 0.0128517 |
| intercept | -1.07085e-05 |
| Log_inc | -0.0290092 |
| Men_5ind | -0.0356388 |
| Men_surf | -0.216941 |
| Ind_snv | -0.218936 |
| Men_pauv | -0.356456 |
| Men_prop | -2.48076 |
| Ind_inc | -9.06301e+09 |
| Ind_4_5 | -9.56827e+09 |
| Ind_0_3 | -1.84451e+10 |
| Ind_18_24 | -2.23668e+10 |
| Ind_6_10 | -2.33952e+10 |
| Ind_80p | -2.44123e+10 |
| Ind_11_17 | -3.23746e+10 |
| Ind_55_64 | -4.92238e+10 |
| Ind_65_79 | -5.48036e+10 |
| Ind_25_39 | -7.29627e+10 |
| Ind_40_54 | -7.69848e+10 |